


Last updated: 9 June 2026
Key highlights
Key Highlights
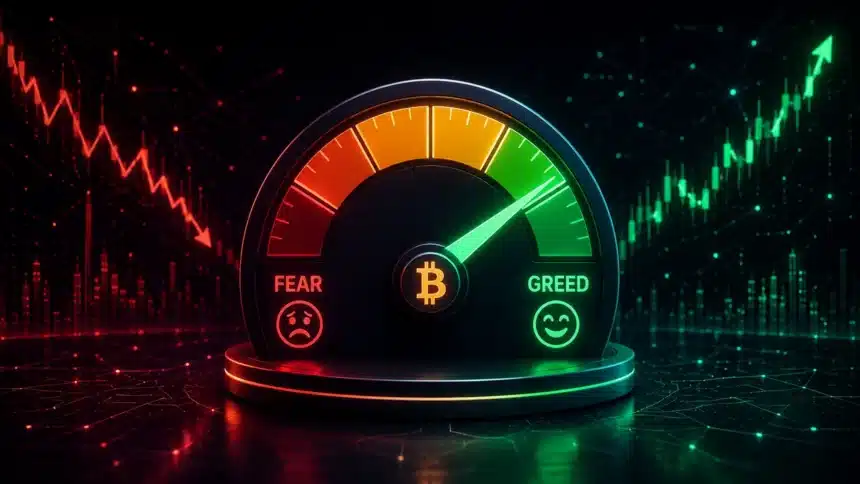
- The Crypto Fear and Greed Index is a daily sentiment indicator published by Alternative.me that scores the market from 0 (extreme fear) to 100 (extreme greed).
- The index combines six data inputs: volatility, market momentum and volume, social media sentiment, Bitcoin dominance, Google Trends data, and surveys.
- Historically, readings below 20 (extreme fear) have corresponded to major buying opportunities. Readings above 80 (extreme greed) have often preceded significant corrections.
- In April 2026, the index hit a reading of 8, its second lowest reading ever, coinciding with Bitcoin trading below $70,000 amid the Iran conflict and mining cost crisis.
- The index is a contrarian indicator: the time when most people are fearful is often when the best opportunities exist, and the time when most people are greedy is when risk is highest.
The Crypto Fear and Greed Index is one of the most widely referenced sentiment tools in Bitcoin markets. Published daily by Alternative.me, it distills the emotional temperature of the cryptocurrency market into a single number between 0 and 100. A reading of 0 represents extreme fear: investors are panicking, selling regardless of price, and convinced that everything will go to zero. A reading of 100 represents extreme greed: investors are euphoric, buying regardless of price, and convinced that the only direction is up. Understanding what the index measures, how it is calculated, and what historical extremes have actually signaled is essential for using it correctly.
How the Index Is Calculated
Bitcoin’s network fundamentals provide the baseline context for interpreting any sentiment reading. The Fear and Greed Index combines six inputs, each weighted differently to produce the final score.
Volatility accounts for 25% of the index. It measures the current volatility and maximum drawdowns of Bitcoin compared to the 30-day and 90-day averages. Unusual volatility increases fear in the index, as sudden large price swings in either direction create uncertainty.
Market momentum and volume also account for 25%. This input compares current trading volume and market momentum against recent averages. When the market is buying on high volume in a positive trend, greed increases. When volume dries up or selling dominates, fear increases.
Social media sentiment contributes 15%. The index scrapes Twitter and Reddit for crypto related posts and measures the rate of interaction and sentiment. High levels of positive engagement signal greed. Unusual spikes in negative or fearful content signal fear.
Bitcoin dominance (the percentage of total crypto market cap that is Bitcoin) contributes 10%. Rising Bitcoin dominance often signals that investors are moving from smaller, riskier altcoins into Bitcoin’s relative safety, which the index interprets as fear driven risk off behavior.
Google Trends data contributes 10%. Searches for terms like “Bitcoin price manipulation” or “crypto crash” suggest fear. Searches for “how to buy Bitcoin” or “Bitcoin price prediction” at elevated levels suggest growing retail interest and potential greed.
Surveys previously contributed 15% but have been suspended since Alternative.me paused the survey component. The remaining weight has been redistributed to the other inputs. The index methodology has been consistent enough over years to make historical comparisons meaningful despite these minor methodological evolutions.
What Historical Extremes Have Signaled
The most useful application of the Fear and Greed Index is as a contrarian signal at extremes. The historical record on this is consistent enough to be worth taking seriously.
In March 2020, as the COVID-19 pandemic triggered a global market panic, Bitcoin crashed from approximately $10,000 to $3,800 in two days. The Fear and Greed Index hit a reading of 8. Over the following 12 months, Bitcoin rose from $3,800 to $57,000, a gain of approximately 1,400%.
In November 2022, as the FTX collapse unfolded and Bitcoin fell to $15,500, the index hit a reading of 6. Over the following 14 months, Bitcoin rose from $15,500 to $73,000, a gain of approximately 370%.
In April 2026, as mining costs exceeded Bitcoin’s market price and geopolitical uncertainty from the Iran conflict drove risk off sentiment, the index hit a reading of 8. By May 2026, Bitcoin had recovered from $71,000 to approximately $95,000.
The pattern at extreme greed readings is equally consistent. In November 2021, as Bitcoin was approaching $69,000 and retail mania was at its peak, the index reached readings above 80 for weeks. Bitcoin proceeded to fall 78% from that peak over the following 12 months. In March 2024, as the post ETF approval euphoria pushed Bitcoin to $73,000, the index briefly hit 90. A correction to $57,000 followed over the next two months before the rally resumed.
Why the Contrarian Signal Works
The fear and greed dynamic reflects a fundamental truth about markets: asset prices fall when the marginal seller runs out of people to sell to, and rise when the marginal buyer runs out of people to sell them assets. At extreme fear readings, most people who wanted to sell have already sold. The remaining holders are often the most conviction driven participants: long term investors, institutions with defined buy programs, and those who have seen prior cycles and understand that recoveries follow corrections.
At extreme greed readings, most people who wanted to buy have already bought. New buyers are increasingly driven by FOMO (fear of missing out) rather than fundamental analysis. The price becomes dependent on an ever larger pool of new buyers entering to support it, a dynamic that eventually exhausts itself.
Warren Buffett’s maxim, “be fearful when others are greedy and greedy when others are fearful,” applies directly to the Fear and Greed Index as a market timing heuristic. It does not provide precise entry and exit points. It provides context: extreme readings increase the probability of mean reversion without determining when it will happen.
The April 2026 Reading of 8: Context and Analysis
The April 2026 reading of 8 was driven by a confluence of factors that individually were concerning and collectively were overwhelming to short term sentiment. Bitcoin was trading near $71,000 while mining difficulty had just dropped 7.8%, signaling significant miner stress. The Iran conflict was pushing energy costs up globally, directly affecting mining economics. The geopolitical risk off environment was reducing risk appetite across all asset classes.
Separately, outflows from Bitcoin ETFs were at their highest level since the products launched. Retail Google search volumes for “sell Bitcoin” and “Bitcoin crash” spiked. Social media sentiment was overwhelmingly negative. Bitcoin dominance was rising as altcoins sold off faster than Bitcoin, a classic flight to relative safety pattern.
Each of these inputs individually would have produced a moderately fearful reading. Together they produced an extreme reading of 8, the second lowest since the index’s inception. Historically, this was exactly the kind of setup that preceded major recoveries, and the price action over the following weeks confirmed the pattern.
Limitations of the Index
The Fear and Greed Index has real limitations that users should understand. First, it is a lagging to coincident indicator: it reflects current sentiment, which means it is low when prices are already low and high when prices are already high. It does not tell you when the bottom or top is; it confirms that the market is at an extreme.
Second, the index can remain at extremes for extended periods. During the 2018 bear market, the index spent most of the year below 30. Miner difficulty adjustments during sustained fear periods confirmed capitulation at each of those lows. and frequently hit readings below 15. Being greedy because others are fearful in a prolonged bear market requires conviction that the asset has long term value, not just a belief that a low reading implies an imminent bounce.
Third, the index reflects Bitcoin specific sentiment and is not directly comparable to broad equity market sentiment indicators like the VIX. Crypto market cycles compress the emotional arc of bull and bear markets into shorter timeframes than traditional markets, making extreme readings more frequent and potentially less meaningful than equivalent readings in equity markets.
How to Use the Index Practically
The most practical application of the Fear and Greed Index is as one input among several, not as a standalone trading signal. Combining it with technical analysis strengthens its value significantly.
When the index is in extreme fear territory (below 20) and technical indicators show Bitcoin near major support, oversold RSI, and declining selling volume, the confluence of multiple indicators pointing to the same direction increases the probability of a meaningful bounce. When the index is in extreme greed territory (above 80) and technical indicators show Bitcoin extended above key moving averages, high RSI, and declining buying volume, the confluence of signals increases the probability of at least a temporary correction.
For long term investors using a dollar cost averaging approach, the index can inform allocation size. Pairing it with an understanding of technical chart signals makes the contrarian thesis much more actionable. Buying more during extreme fear and less during extreme greed systematically improves average cost basis over a full cycle. It does not require calling the exact top or bottom, just recognizing the general phase of the market cycle and adjusting accordingly. Combined with an understanding of where Bitcoin is in its halving cycle and the broader macro environment, the Fear and Greed Index becomes a useful component of a disciplined investment framework rather than a source of anxiety.