Last updated: 25 May 2026
Bitcoin is trading at $80,435 on May 9, 2026, with a Relative Strength Index of 60.82 indicating momentum without overbought conditions, sparking speculation about a potential price surge to $85,000. CoinDesk analysis has identified three key signals that could drive this move, according to industry experts. Meanwhile, Polymarket prediction markets currently price the probability of Bitcoin reaching $85,000 in May 2026 at over 40%.
Key Highlights
- Bitcoin is trading at $80,435 on May 9, 2026, with an RSI of 60.82, indicating momentum without overbought conditions
- CoinDesk analysis has identified three specific signals pointing to a possible Bitcoin move to $85,000
- Polymarket prediction markets currently price the probability of Bitcoin reaching $85,000 in May 2026 at above 40%
- BeInCrypto’s quantitative model forecasts a May 2026 average price of $82,102, with Standard Chartered maintaining a $150,000 year end target
- Bitcoin has risen 27% from its February 2026 low of $63,000, driven by a combination of technical and structural factors
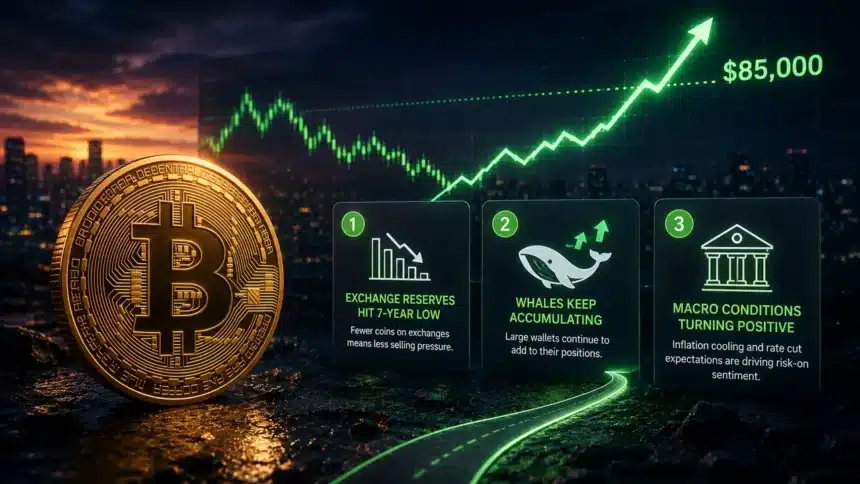
Bitcoin has been holding above $80,000 since late April 2026, consolidating in a range that technical analysts are characterizing as a launchpad rather than a ceiling. The specific argument that $85,000 is the next significant price target before the end of May rests on three distinct signals: an RSI reading that sits in momentum territory without touching overbought levels, a sustained pattern of exchange reserve compression that creates mechanical buying pressure, and institutional positioning data showing that large buyers were actively accumulating during the February to April consolidation period at prices well below current levels.
These signals are not new analytical frameworks. They are standard tools of market analysis applied to data that has rarely aligned this favorably simultaneously. Understanding each signal individually and then reading them together provides the clearest picture available of why professional traders and institutional research teams are setting $85,000 as the near term price target for Bitcoin. The structural supply compression driving Bitcoin’s current price is analyzed in depth in a companion piece, but the technical signals examined here complement that structural thesis by showing that momentum indicators support continued price appreciation rather than warning of an imminent reversal.
Signal One: RSI at 60.82, the Sweet Spot for Sustained Runs
Bitcoin’s Relative Strength Index is 60.82 as of May 9, 2026. The RSI is a momentum oscillator that ranges from 0 to 100, with readings above 70 traditionally indicating overbought conditions and readings below 30 indicating oversold conditions. At 60.82, Bitcoin is above the neutral 50 level, confirming positive price momentum, while remaining below the 70 threshold that tends to precede mean reversion corrections.
The significance of the current RSI level is clearer when placed in historical context. Bitcoin’s strongest sustained price runs, the moves that lasted multiple weeks and covered 15% or more of price appreciation, have overwhelmingly begun when the RSI was in the 55 to 65 range. Moves that began with RSI above 70 tended to exhaust quickly as profit taking from short term buyers compressed the gains. Moves beginning in the 55 to 65 range had the momentum to attract follow on buying from the next tier of buyers as the price moved, creating self reinforcing upward momentum rather than a sharp spike followed by a reversal.
The late 2020 Bitcoin run that took the price from $15,000 to $29,000 by year end began with an RSI reading of 62 in early October 2020. The April 2021 run that took Bitcoin to $64,000 began with an RSI of 58. Neither example proves that history repeats precisely, but the pattern suggests that RSI in the low 60s at the start of a momentum phase is associated with sustained moves rather than brief spikes. The ETF demand environment in 2026 adds an institutional buying floor that was absent in 2020 and 2021, which may extend the duration of momentum phases by providing consistent demand even during intraday pullbacks.
Signal Two: Exchange Reserves at a 7-Year Low Create Mechanical Price Pressure
The second signal is the exchange reserve level. Bitcoin exchange reserves at a seven year low matter for the $85,000 target because the mechanism is mechanical: when exchange supply is thin and demand increases, even marginally, the price impact is amplified relative to what the same demand increment would produce in a market with normal exchange liquidity.
The arithmetic is important here. If a buyer wants to purchase $100 million of Bitcoin and the exchange order book has $500 million of sell side liquidity available within a 2% price range, the purchase moves the price approximately 0.4%. If exchange reserves have declined to a point where only $200 million of sell side liquidity exists within that range, the same $100 million purchase moves the price approximately 1%. The thinner the order book, the larger the price impact per unit of demand. Exchange reserves at a seven year low mean that each dollar of institutional or ETF buying has more price impact than it would have had at any point in the past seven years. Bitcoin’s seven year low in exchange reserves combines with the current RSI level to create a market structure where upward price moves are easier to sustain and downward moves require more sustained selling pressure to maintain than in a typical market environment.
Signal Three: Institutional Accumulation During the Consolidation Confirms Conviction
The third signal is the large wallet accumulation data. Wallets holding more than 1,000 BTC net added approximately 270,000 BTC to their holdings between early March and early May 2026, at prices ranging from $63,000 to $78,000. This accumulation pattern, buying during a period of price weakness and sideways movement rather than during a breakout, is characteristic of institutional buyers who have a target price or thesis that extends well beyond the immediate market level.
The significance for the $85,000 price target is in the cost basis of those accumulations. Large holders who bought in the $63,000 to $78,000 range have unrealized gains at $80,000 but have not been selling, as exchange reserve data confirms. That behavior implies conviction that the price target they are holding toward is substantially above current levels. Institutional investors with a $63,000 average cost and a $150,000 year end target, the Standard Chartered estimate, have no incentive to sell at $80,000 or $85,000. Their continued holding removes potential sell side pressure from the market at the same time that their accumulation has already removed supply from exchanges. BlackRock’s IBIT ETF approaching $45 billion in assets under management represents the institutional equivalent of this same conviction: long term position building that treats current prices as accumulation opportunities rather than exit points.
What Polymarket Says
Polymarket, the decentralized prediction market platform, currently prices the probability of Bitcoin reaching $85,000 in May 2026 at above 40%. Prediction markets aggregate the probability assessments of a large number of participants who are risking real money on their assessments, which tends to produce calibrated probability estimates that correlate with actual outcomes more accurately than analyst forecasts.
A 40% probability is not a forecast that Bitcoin will reach $85,000, but it reflects the collective assessment of prediction market players that the move is more likely than not over the coming three weeks. For comparison, the same market was pricing the probability of Bitcoin reaching $80,000 in April at around 35%, and that level was achieved. The Polymarket odds are one data point, not a definitive signal, but they represent a real money aggregate view of the probability distribution for Bitcoin’s near term price. The Federal Reserve policy backdrop, which currently prices a 65% probability of a September rate cut, adds a macro probability layer that is partially already embedded in Bitcoin’s current price level and could provide incremental upside if the probability of a cut increases further.
What Could Prevent the $85K Move
The three signals pointing to $85,000 are real, but they are not certainties. The most likely scenario that would prevent the move in May is a macro shock that triggers broad risk asset selling. A surprise Federal Reserve communication suggesting rate cuts are further away than markets expect, a significant geopolitical escalation beyond current Iran tensions, or a major risk event in the equity market could all generate selling pressure that overrides the structural Bitcoin setup.
On the crypto specific side, a large exchange hack, a major protocol failure, or a regulatory surprise in the US could generate Bitcoin specific selling regardless of broader market conditions. Coinbase’s May 8 outage resolved without fund loss and without a meaningful Bitcoin price reaction, which is consistent with the market distinguishing between operational disruptions and fundamental security events. A genuine security breach at a major custodian would be a different category of event entirely.
The TCB View
Three aligned signals pointing in the same direction deserve attention, but they deserve interpretation rather than blind extrapolation. The RSI, exchange reserve, and institutional accumulation data all support the case for Bitcoin moving toward $85,000 in May. They do not guarantee it. The more durable insight from these three signals is not that $85,000 arrives on a specific date but that the structural conditions for continued price appreciation are more favorable than at any comparable point in the current cycle. Whether the market reaches $85,000 in May or in June matters less than whether the structural forces driving the current rally, supply compression, institutional demand, and improving macro conditions, are intact. As of May 9, 2026, they are all intact. That is the more important signal.
The Daily Brief
What's moving crypto, AI and markets, explained in 5 minutes. Every weekday morning.