OFFICIAL TRUMP (TRUMP) Price Analysis: Battling the Market Downturn The crypto asset OFFICIAL TRUMP (TRUMP) is currently trading near the $7 mark, despite a general slowdown and “fearful” condition in the broader cryptocurrency market. Most major crypto assets, including Bitcoin (BTC) and Ethereum (ETH), are experiencing losses, with the overall market value dropping by over 2.02%. TRUMP, however, is showing a slightly more resilient, yet still downward, trend, having registered a 1.32% loss.
Recent Trading Activity and Key Figures
TRUMP has seen some dynamic trading in the recent past:
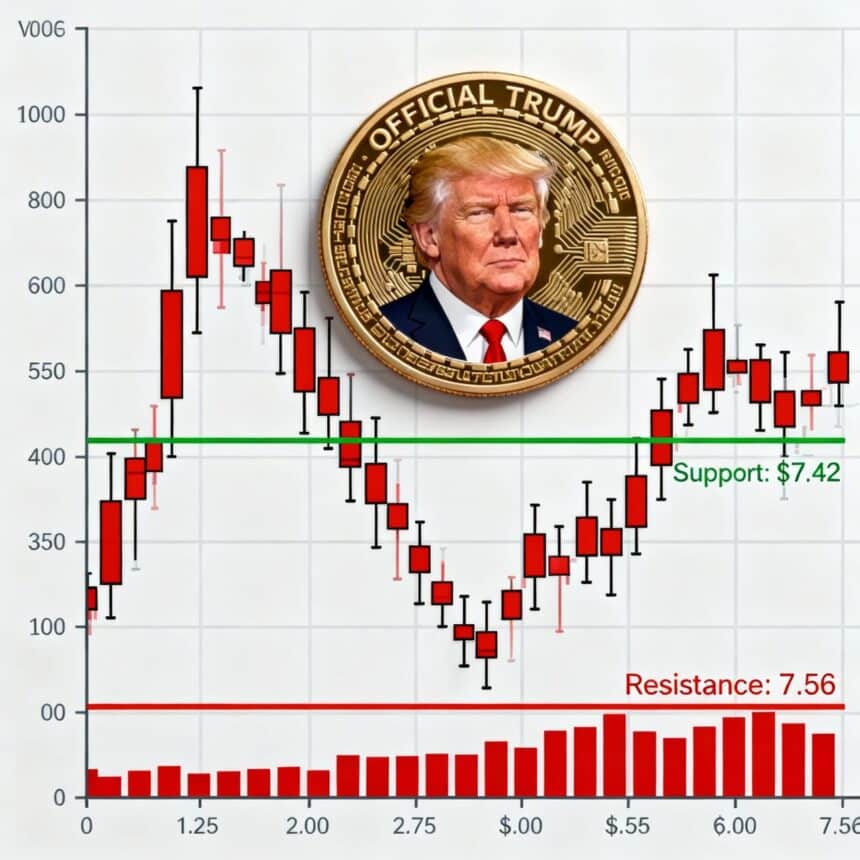
- Trading Range: In the morning hours, TRUMP reached a high of $7.66 before “bears” (sellers) entered the market, pushing the price down to a low of $7.36.
- Current Price: Data from CoinMarketCap (CMC) shows OFFICIAL TRUMP currently trading around $7.49.
- Market Size: The token’s market capitalization has reached a significant $1.5 billion. ● Trading Volume Surge: Critically, TRUMP’s daily trading volume has soared by over 46.74%, reaching $307.22 million. This jump in volume suggests a high level of interest and activity in the token, even if the price is declining.
- Liquidations: Data from Coinglass indicates that $1.20 million worth of TRUMP was “liquidated” in the last 24 hours. Liquidations occur when leveraged trading positions are automatically closed due to insufficient margin, a common sign of volatility and downward pressure.
The Main Question: Will TRUMP Find Support or Slip Further?
The immediate outlook for TRUMP is a tug-of-war between buyers and sellers, according to its price chart.
Bearish Scenario ( price decline)
The chart currently displays a bearish turn, meaning sellers are dominating. The “red candlesticks” are a visual signal of this drop. If selling pressure continues, here are the key levels to watch:
- Initial Support: Sellers could pull the price back to the support range around $7.42. This is a level where buyers might step in to prevent further drops.
- Further Decline: If sellers gain more strength, the price could drop further, potentially leading to a “death cross”—a technical signal indicating a significant long-term downtrend—which might drive the price to a low range of $7.35.
Bullish Scenario (Price Recovery):
If buyers manage to regain control and the price starts to recover, the movement will be upward:
- Nearest Resistance Test: A recovery would first mean testing the nearest resistance level at $7.56. This is a price point where sellers have previously stepped in, halting upward movement.
- Stronger Rally: If the upside momentum is strong, it could trigger a “golden cross”—a bullish signal—potentially pushing the price toward the $7.63 zone.
Technical Indicators: A Mixed Signal
Technical analysis tools provide a detailed look at the internal market dynamics for TRUMP:
- MACD (Moving Average Convergence Divergence):The MACD line is above its signal line, which is a sign of short-term bullish momentum. However, both lines are below the zero line, which indicates that this short-term optimism is happening within a larger, broader bearish trend. Essentially, the bulls (buyers) are trying to push the price up, but the overall market environment is still negative.
- CMF (Chaikin Money Flow):The CMF indicator sits at 0.09. Since a reading above zero suggests buying pressure, this number indicates a slight amount of buying pressure in the market. Crucially, the analysis notes this pressure is not yet strong enough to signal a major reversal.
- RSI (Relative Strength Index):The RSI is at 36.80. The RSI measures momentum, and a reading below 30 typically signals “oversold” (meaning the price might bounce back). At 36.80, the asset is approaching oversold conditions, but hasn’t reached an extreme level. This suggests the downtrend could continue if buying strength remains weak.
- BBP (Bull Bear Power):The BBP reading is -0.11, which signals a modest dominance by the bears (sellers). While not extremely strong, this bearish force is enough to keep the price under pressure.
In summary, OFFICIAL TRUMP is experiencing high trading volume and volatility as it battles a broader market downturn. Key technical indicators present a complex picture: there is a short-term, modest buying effort (MACD and CMF) occurring, but this is overshadowed by persistent bearish pressure (RSI and BBP), making the immediate price direction unclear and highly sensitive to shifts in buyer or seller strength around the critical support and resistance levels.