Last updated: 9 April 2026
Key Highlights
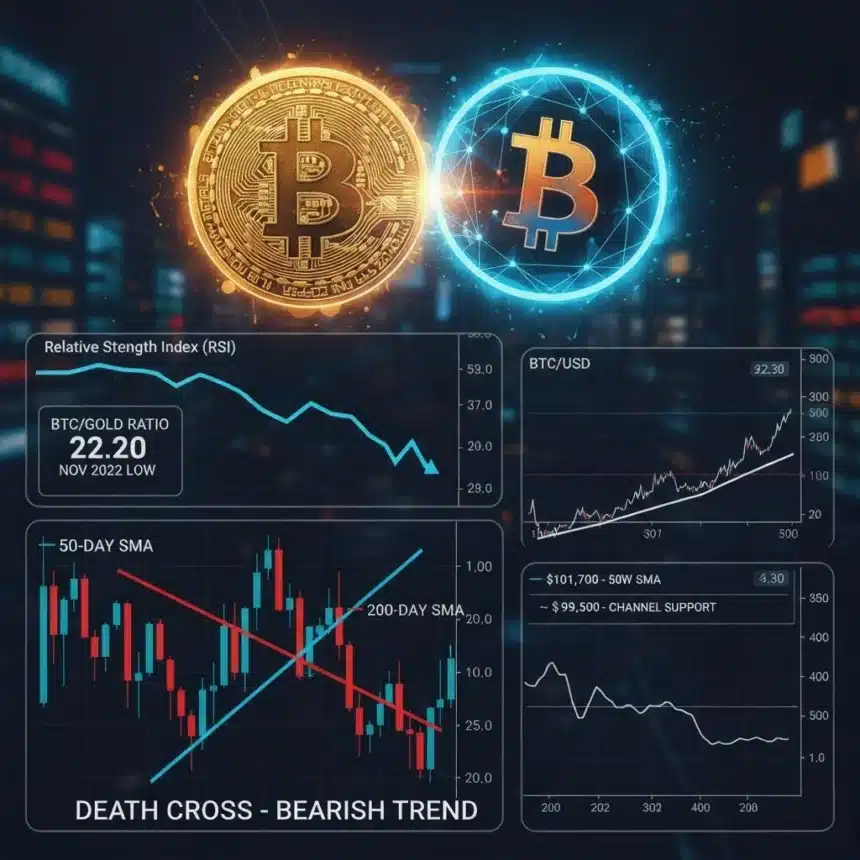
- The Bitcoin-to Gold ratio is at its most oversold level since November 2022
- Despite the oversold signal, the ratio is in a strong downtrend, confirmed by a bearish “death cross,” meaning sellers currently remain dominant
- For BTC/USD, the 50 week SMA near $101,700 is the key support level; a sustained break below it would signal a major risk to the bull market
- Bitcoin against the dollar is not yet oversold (RSI suggests room to fall), and technical signs indicate selling pressure could continue toward the channel bottom near $99,500
Right now, there’s a buzz among some cryptocurrency fans hoping for a major shift in the financial world: money rotating out of the red hot gold market and into Bitcoin. Their hope is that Bitcoin, which has been struggling lately, is about to make a comeback, partly funded by investors selling their gold.
The BTC/Gold Oversold Signal
This hope is fueled by a key technical indicator: the Bitcoin to Gold ratio. This ratio simply compares the price of one Bitcoin to the price of one ounce of gold.
- The Big Signal: This ratio is currently at its most “oversold” level since November 2022, according to a widely used tool called the Relative Strength Index (RSI).
- What is Oversold? The RSI measures the speed and change of price movements. When it drops below 30 (it’s currently around 22.20), it suggests that an asset in this case, Bitcoin compared to gold has been sold off too hard, too fast. Think of it like a coiled spring: it’s been pushed down so much that it might be ready to snap back up. This often signals that the ratio is undervalued.
Why Bulls Need to Be Patient
While the oversold RSI is a positive sign for Bitcoin bulls (those who think the price will rise), it’s not a guarantee of an immediate turnaround. A key phrase to remember is: “Oversold can remain oversold.”
- The Bearish Reality: Despite the low RSI, the Bitcoin to Gold ratio is still clearly in a strong downtrend. This means sellers are still dominating the market.
- The “Death Cross”: The trend is reinforced by a very bearish technical event called a “death cross,” which recently occurred. This happens when a short term moving average (the 50 day) crosses below a long term moving average (the 200 day). It is a classic signal of a confirmed, long term downward trend.
- What’s Needed: Before investors can expect a sustained recovery, they need to see confirming signals. This could mean the price movement itself stops hitting lower lows, a sudden surge in buying volume, or other indicators that show the sellers are finally exhausted.
The Outlook for Bitcoin Against the Dollar (BTC/USD)
The bad news isn’t limited to the gold comparison. Bitcoin’s performance against the U.S. dollar is also flashing warning signs, suggesting the recent sell off might not be over yet.
Key Price Levels to Watch
Bitcoin’s dollar denominated price is currently under serious pressure. Many analysts are looking at a few critical levels:
- The {$101,700} Support: The 50 week Simple Moving Average (SMA), currently around $101,700, is one of the most important levels on the long term chart. Throughout the entire bull market that started in early 2023, this moving average has acted as a consistent, reliable floor. If the price closes significantly below this level, it would be a major cause for concern.
- The {$99,500} Channel Support: BTC’s price is also currently in a wide, defined price pattern called an “expanding channel.” The bottom boundary of this channel, around $99,500, is the next major target for sellers if the current downward momentum continues. Dropping below this level would confirm a more aggressive downward move.
Technical Signs Against the Dollar
Unlike the BTC/Gold ratio, Bitcoin’s dollar price is not yet oversold on the 14 day RSI.
- More Room to Fall: This means there’s still “room” for the price to drop lower before it hits a level considered extreme.
- Momentum is Negative: Another indicator, the MACD histogram, is also showing deep negative bars, which simply tells us that the selling momentum is strong and growing.
- The {200}-day SMA: The fact that the price has now fallen and is trading below its 200 day Simple Moving Average is a classic sign for momentum traders to sell, which could add further pressure to the price.
The Bottom Line
While the low BTC/Gold RSI suggests Bitcoin is historically cheap compared to Gold, the overall technical picture both against gold and the dollar is overwhelmingly bearish.
For investors, the message is clear: Patience is required. Bulls should wait for clear, confirming signs of a trend reversal like a break above key resistance or a significant volume spike before betting on a sustained recovery, especially as the major support level of $101,700 and the psychological barrier of $100,000 are currently under threat.
Free Daily Briefing
Get the Daily Briefing
Crypto, AI, and Web3 intelligence. Free, every day.
The Daily Brief by TCB
Crypto, AI & finance intelligence in 5 minutes. Every weekday morning. Free.